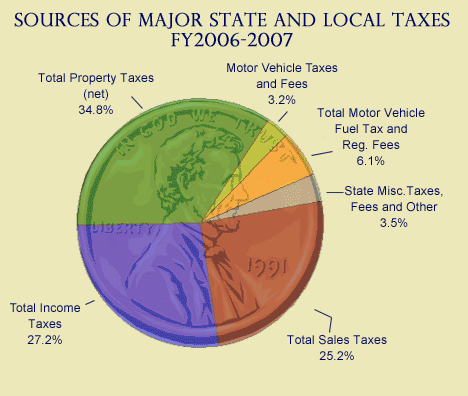
Taxes in Nebraska > Sources of Major State and Local Taxes

[
Click on an item in the pie chart
above to view related information. ]
|
Introduction This portion of the presentation explores the major state and local taxes that support public spending in Nebraska. These taxes include local property tax, state and local sales and compensating use tax, individual and corporate income tax, state motor fuels tax, motor vehicle taxes and fees, and motor vehicle registration fees. Click on the particular slice of the coin that you are interested in for analysis of historical trends, taxpayer sector analysis, program descriptions, and major policy reforms. The study period examined usually incorporates information from fiscal years 1980-81 to 2006-07. This section also includes some information on various miscellaneous state taxes for which we have historical information. As seen in the above pie chart, miscellaneous receipts constitute 3.5% of the total. Some miscellaneous taxes are individually described and the total historical receipts are detailed in this presentation. We have no historical information on local taxes other than property taxes and municipal sales taxes, so miscellaneous local taxes, such as municipal occupation and franchise taxes, parking meter revenue and county inheritance taxes, are ignored throughout this presentation. 1. The property tax continued to bear the largest load of the total tax burden in Nebraska in FY2006-07. Net property taxes (net means after subtracting homestead exemptions or other credit programs) comprise 34.8% of the entire burden, slightly more than one-third. Income taxes, individual and corporate, combine to contribute 27.2% of the total; sales taxes constitute 25.2% of the total. 2. The analysis pages linked below show that the total tax burden faced by Nebraskans has grown relative to the size of the Nebraska population and economy since 1980-81. Taxes as a percent of personal income were 11.3% for FY2006-07, a slight reduction from the previous year, which was the highest in the study period. This is not the highest on record, however. Overall state and local taxes were 11.5% of personal income in FY1967-68. 3. The property tax has been declining in relative importance to the state and local tax system since 1980-81. Property taxes have shrunk from 45% of the state and local tax mix to about 35% today. Property taxes have been replaced by sales and income taxes largely through state aid to local governments and increased local use of the sales tax. Recent state revenue difficulties have reversed this trend the past four years, raising the question of whether or not this long-term trend will be sustained in the future. Below, you will find links to an analysis of historical trends in the state and local tax system and an analysis of changes since 1980-81, including shifts in the state-local shares. A chronology of enacted legislative changes in tax policy in the past 35 years may also be accessed by clicking on "Chronology of Changes in Tax Policy Since 1982". The analysis box leads to some information about two of the major policy trends of the last 25 years, the replacement of property taxes with sales and income taxes and the growth of economic development incentives. There is also a link to a description of tax policy principles that are used throughout this presentation to describe characteristics of Nebraska's major tax programs. Clicking on "State and Local Overall Tax Burden Rankings" will show how Nebraska compares to other states in the region and nation and the last box contains tabular historical information about the overall state and local tax structure. |
Additional Information:
-
State Taxes: Includes state sales tax (including motor vehicles), corporate and individual income taxes, miscellaneous taxes and fees (cigarette tax, liquor tax, etc...) and all motor fuel taxes and registration fees
-
Local Taxes: Includes property taxes (net of homestead exemption) and city sales taxes. Excludes revenue sources for cities and counties such as inheritance tax, wheel tax, and franchise taxes as data at the statewide level is not available.