![]()
STATE AND LOCAL OVERALL TAX BURDEN RANKINGS
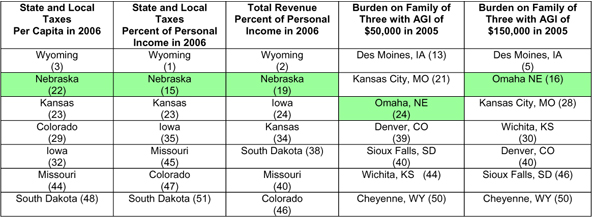
Columns 1 & 2: U.S. Bureau of the Census, State and Local Collections (2006) as calculated and ranked by the Federation of Tax Administrators, 2008.
Column 3: U.S. Bureau of the Census, State and Local Collections (2006) as calculated and ranked by the Legislative Fiscal Office.
Columns 4 and 5: 2005 Tax Rates & Burdens, Department of Finance, District of Columbia.
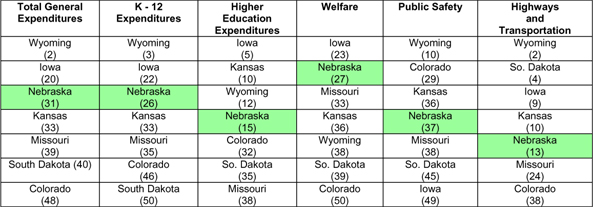
| Within the tax burden ranking chart above, Nebraska is compared to the six states it borders; they are ordered in each column from highest to lowest. The national rank is shown in parentheses behind each state. In overall tax burden, Nebraska has become a high tax state. We are ranked near the top third both per capita and as a percent of personal income. This is much higher than has been true historically. For example, while in 2006, Nebraska ranked 15th in taxes as a percent of personal income, in 1994, Nebraska was 17th and in 1984 we were 23rd. The household burden as shown by the tax burden study conducted annually by the Department of Finance of the District of Columbia (columns 4 and 5) offers a more favorable report for low-income families. Our progressive income tax means that the burden relative to other states is much lower with regard to the $50,000 family (24th) than the $150,000 family (16th). [For more information on this issue, visit the section on income taxes.] The U.S. Census Bureau also collects and reports data on total revenues and expenditures. Total general revenue differs from the taxes because it includes fees and charges and federal funds. Because Nebraska ranked 28th in federal funds and 21st in fees and charges, our rank drops to 19th highest as a percentage of personal income for total general revenue. The rankings of surrounding states are shown in the middle column. The table below shows how Nebraska and the surrounding states rank in expenditures as a percent of personal income. What is shown is total expenditures and the five largest categories of spending that are reported, not including a catch-all miscellaneous category. As shown by the table, Nebraska ranked 31st in total spending and was only in the top half in two categories, higher education and highways. While it is beyond the scope of this presentation on taxes to discuss expenditures in great detail, it is a bit of a mystery as to how it is possible for Nebraska to rank high in taxation as a percent of personal income, average in general revenue, and yet rank so low in total spending, all from the same data base and the same year of comparison. STATE
AND LOCAL OVERALL SPENDING RANKINGS 2006
Source: U.S. Bureau of the Census, State and Local Expenditures, 2006 as calculated and ranked by the Legislative Fiscal Office. We know from the data on fees and charges and federal funds that non-tax general revenues cannot explain all the difference. We also know that total general revenues in 2004 were 21.8% of personal income while total general expenditures were 20.2%, a difference of 1.6% of personal income or about $800 million. The United States averages for both were much closer – 20.6% for revenues and 20.8% for expenditures. Therefore, in Nebraska, total spending was slightly below the national average while revenues, including tax revenues were significantly over average. When this data is examined over the past 30 years, general spending and general revenues average out to approximately the same number nationally. In Nebraska, revenues outpace expenditures by about 1% consistently. |