Taxes in Nebraska > Source of Major State and Local Taxes > Historical Trends in Major State and Local Taxes
HISTORICAL TRENDS IN MAJOR STATE AND LOCAL TAXES


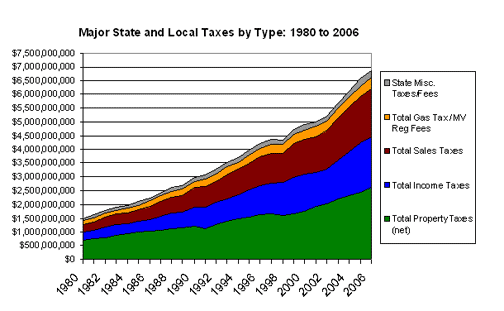
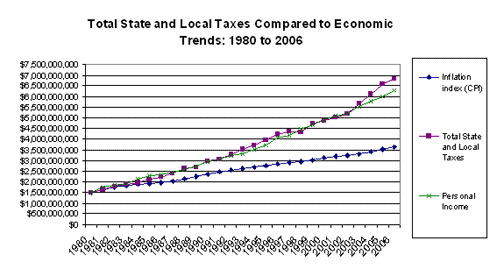
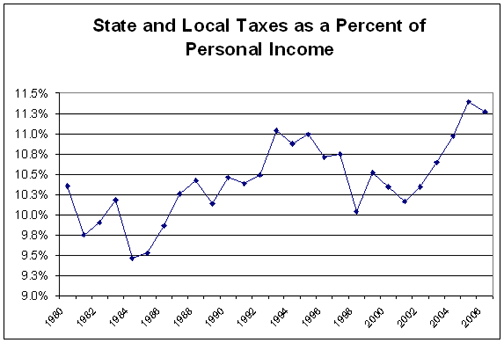
| NOTE: The growth rate in inflation during this period was 237% and the growth rate in the economy, as measured by Nebraska personal income was 411%. The first chart shows growth in all major state and local taxes since 1980 and the relative changes in each. As is detailed in "Analysis of Major State and Local Taxes", sales and income tax growth has exceeded property tax growth until recent years. However, in fiscal years 2001-02 and 2002-03, income taxes decreased while property taxes increased a similar amount. This reversal of the trend was due to the revenue woes experienced by Nebraska and most other states in the first part of this decade. These revenue declines were especially sharp in income tax receipts. This historical trend resumed in FY2004-05. The chart immediately above shows that on the whole, major state and local taxes have grown slightly faster than the growth in the economy, as measured by Nebraska Personal Income reported by the U.S. Census Bureau, especially in the last three years. Another way to demonstrate this point is on the chart below, which shows total major state and local taxes as a percent of personal income in Nebraska. Since FY1980-81, major state and local taxes as a percent of personal income never exceeded 11% until this past year and have never been less than 9.5%. For FY2005-06, it was 11.4%, higher than any year in the study period and the highest since FY1971-72. The average since FY1967-68 is 10.4%. This percentage improved only slightly, to 11.3% in FY2006-07.
These charts are derived from U.S. Census Bureau information, including the Consumer Price Index for all Urban Consumers and Nebraska personal income. These numbers are subject to annual revision by the bureau. |
