Taxes in Nebraska > Users and Uses of Major State and Local Taxes > Local Use > K-12 Schools
K-12 SCHOOLS' USE OF STATE AND LOCAL TAXES


|
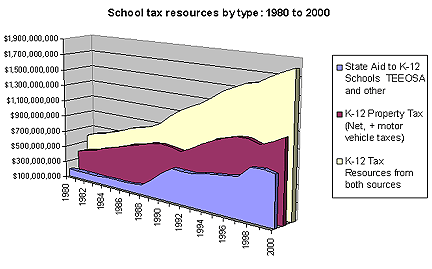
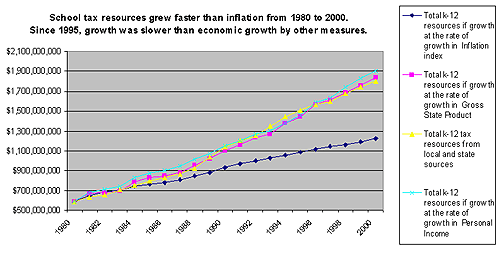
Key Points The two charts above show the growth in K-12 school resources, through both property taxes and state aid over the 20-year study period. First, it should be clear that the growth in total resources available to schools has generally kept pace with the growth in the economy, as measured by gross state product (GSP) over the period. The most recent five years have seen a break from this trend, as school resources have begun to lag behind economic growth. Also, the growth of state aid to schools and the growth in property taxes appear to be mirror images of each other. Property taxes in support of K-12 education have risen the fastest when state aid growth has been the slowest and vice versa. |
Additional Information: