Taxes in Nebraska > Users and Uses of Major State and Local Taxes > Local Use > Cities > Source of City Government Taxes
SOURCE OF CITY GOVERNMENT TAXES

|
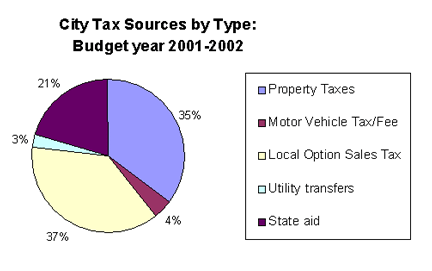
Local option sales taxes generate 37 percent of the tax dollars used to fund city governments, the most of any source. Property taxes come in second at 35 percent while state aid makes up only 21 percent of the total. |


|
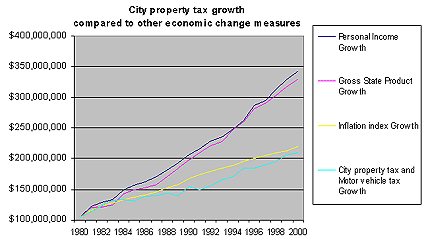
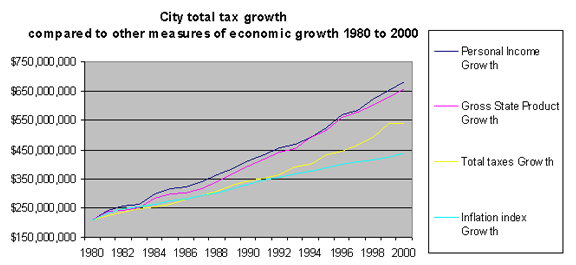
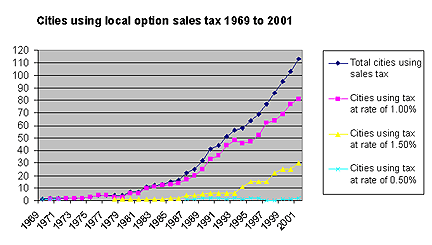
Key Points The charts above show historical trends in city government finance. The first chart ("Cities Using Local Option Sales Tax") shows that the number of cities using the local option sales tax has risen dramatically over the years. In fact, the number of municipalities using the local option sales tax doubled between 1995 and 2000. Many municipalities have also increased the rate of an existing sales tax. The next chart ("City Property Tax Growth Compared to Other Economic Change Measures") examines city property tax growth as compared to inflation and Nebraska economic growth. The Consumer Price Index - all Urban Consumers data is the source of the inflation figures, and the measure used for economic growth is the Nebraska gross state product (GSP). Both are based on data collected by the U.S. Bureau of the Census and are subject to change from time to time. Property tax and motor vehicle tax growth in support of Nebraska municipalities has been at a lower rate than even inflation over the 20 years. Considering all tax sources, city resource growth has been greater than the rate of inflation, but less than the rate of growth in the economy. This growth in resources is due to the rapid growth in municipal sales taxes and not growth in state aid, which has remained fairly stagnant over the period. Municipal sales tax growth has been one-third faster than the growth in the economy over the period. |
Additional Information:
