Taxes in Nebraska > Sources of Major State and Local Taxes > Property Taxes > Property Taxes by Sector > Residential Property Taxes
RESIDENTIAL PROPERTY TAXES

|
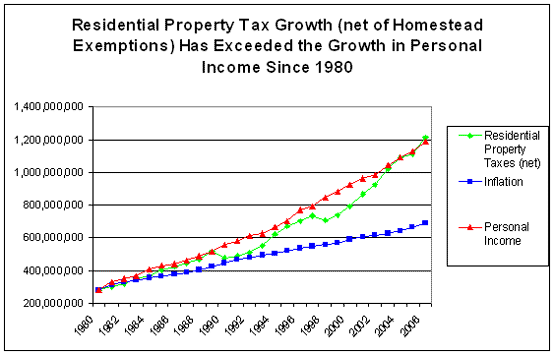
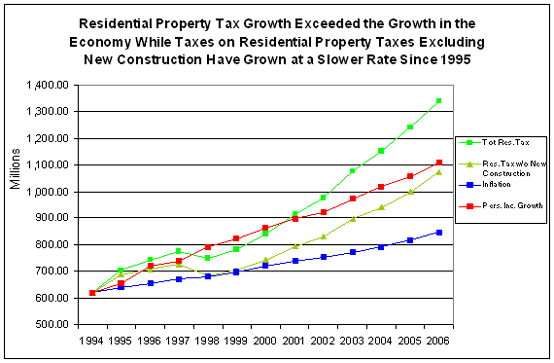
The chart above compares the growth in residential property taxes to the growth in the economy and inflation. The first chart shows that residential property taxes kept pace with the growth in the economy throughout the 1980s. LB 1059, enacted in 1990, lowered the level of all property taxes by increasing state aid to schools by close to $200 million. However, after this initial reduction, the growth trend was again approximately at the rate of growth in the economy. LB 1114, which imposed levy limits on all local governments, including schools, beginning in 1998 and LB 806, another major school finance reform, lowered property taxes immediately. Since 1998, however, the rate of growth for residential property taxes has been accelerating. The recent trend has been growth that is faster than the growth in the economy fuelled at least in part by cuts in aid to local governments that were necessary in the first part of the current decade. For a more complete discussion of this acceleration of property taxes levied on residential property, go to "Major Trends in Tax Policy - The Shift in Base to Residential Property."
* Excludes
taxes on new construction or remodeling that has occurred
since 1994, estimated using the average residential property
tax rate. Part of the growth in property taxes is taxation of new houses on land that used to be farmland. Therefore, the second chart mathematically estimates and removes the impact that new construction has on property taxes levied. By excluding the impact of new construction, the growth in property taxes since 1994 is more than the rate of inflation, but less than the rate of growth in the economy. Since 1995, the Department of Property Assessment and Taxation has collected and reported new construction valuation (not taxes) from county assessors and reported it. The second chart was derived by adding up the new construction that has occurred since 1995, applying the current average residential tax rate statewide to the total and subtracting the result from the statewide taxes levied on residential property. In this way, the chart shows the approximate impact on residential property existing in 1994. |
