Taxes in Nebraska > Sources of Major State and Local Taxes > Income Tax > Individual Income Tax > Individual Income Tax Receipts and Liability
INDIVIDUAL INCOME TAX RECEIPTS AND LIABILITY

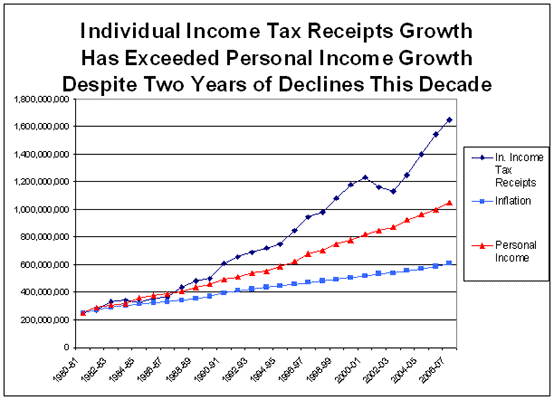
| Some activity on the chart above -- such as spikes and troughs -- can be traced to policy decisions made by the Legislature. To view additional information about these changes, click on a bill number below. A chronology of legislative action will open in a new window; the bill you selected will be viewable at the top of the new page. | |
| YEAR | LEGISLATIVE ACTIVITY |
| 1987 | LB 773 |
| 1990 | LB 1059 |
| 1993 | LB 240 |
| 1997 | LB 401 |
| 2002 | LB 1085 |
| 2003 | LB 759 |
| 2006 | LB 968 |
| 2007 | LB 367 |
|
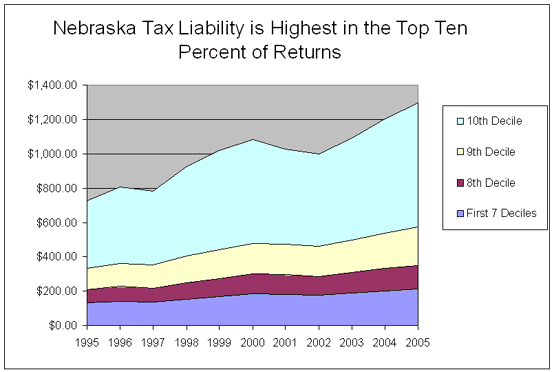
As the table above demonstrates, the growth in individual income tax receipts has far exceeded the growth in the Nebraska economy or inflation. This is for two reasons. First, the income tax base is by nature more dynamic in that it tends to produce revenue growth that is greater than economic growth without changing the rates of the tax. Among the reasons for this is the progressive nature of the tax. By progressive, we mean that it taxes a larger share of the income of a high income taxpayer than a low income taxpayer. Because the brackets in the Nebraska income tax are not indexed to inflation, increases in income over time result in higher average tax rates as applied to individuals. Nebraska has a more progressive income tax than most other states, a proposition discussed in the narrative description of the Nebraska individual income tax. The progressive nature of the income tax is also apparent from the area chart below. |

|
This area chart compares the amount of tax liability shown on all returns filed in Nebraska grouped by the amount of federal adjusted gross income. The lowest 70% of returns are those with federal adjusted gross income of $30,000 or less, while the highest 10% are those with federal adjusted gross income over $70,000. It is not a comparison of families. Certainly, many of the returns with the lowest federal adjusted gross income were filed by students or others that are not a major breadwinner for the family. Nevertheless, the chart is telling. The highest income 10% of all returns filed carried more than half of the Nebraska tax liability for the entire state. The revenue derived from the Nebraska individual income tax depends a great deal on the success of high income taxpayers. Another reason the growth of individual income tax receipts has exceeded the growth in the economy is that rates have increased. In 1980, the individual income tax rate was 15% of federal tax liability. The rate had recently been lowered from 18% to decrease an excessive state surplus. In 1987, the Legislature adopted LB 773, which decoupled the Nebraska income tax from federal liability and recoupled it to federal adjusted gross income, so a comparable current rate cannot be definitely established. However, it would be approximately 25% if Nebraska were to move back to the old system and collect the same amount of revenue. The impact of the 17% income tax rate increase that was operative in two stages, 1990 and 1991 to fund the school finance initiative, LB 1059, can be seen in the chart. The income tax rate reduction in LB 401 (1997) is less apparent because it was much smaller in relationship and occurred during a period of rapid growth in the revenue stream. |
Additional Information: