Taxes in Nebraska > Sources of Major State and Local Taxes > Major Policy Trends - The Growth of Economic Development Tax Incentives > Cost of Nebraska's Tax Incentive Programs
COST OF NEBRASKA'S TAX INCENTIVE PROGRAMS
- Regarding
the Employment and Investment Growth Act, the Department of Revenue
annually publishes a report containing statistics regarding investment,
employment, wages and credits and refunds earned and used. From this
information it is possible to estimate the annual "cost"
of the Employment and Investment Growth Act. Of course, such an estimate
would be subject to considerable disagreement. Most business groups
are of the opinion that investment incentives have no cost because there
would be far less growth in the economy without them. Nonetheless, it
seems fair to point out that there is no empirical support for the notion
that targeted incentives have a cost of zero. There is disagreement
among economists as to what the cost is, but little disagreement with
the conclusion that there is a cost.
The key to the calculation is the assumption which must be made as to how many of the new jobs claimed are actually created by the availability of the credits. Stated the other way, we know that much of the growth in jobs and investment, claimed by beneficiaries of the programs would have occurred regardless of the existence of the credits. Benefits paid to companies in these situations are clearly costs borne by the other taxpayers without any benefits due to new income tax or consumption tax revenues. Determining the cost of incentive programs turns on the issue of what percentage of the claimed jobs and investment actually add to the economy of the state and what percentage merely decreases revenues.
It is possible to calculate a range of costs. At one end of the range is the assumption that the Employment and Investment Growth Act has had no affect whatsoever on economic activity in the state. This is essentially the conclusion reached by Professor Ernie Goss of Creighton University in his work published in Economic Development Quarterly comparing growth in Nebraska counties in which LB 775 beneficiaries have claimed to have added jobs and investment compared to other counties in which there are no claims for LB 775 induced jobs and investment. While the study is able to find a positive correlation between counties in which LB 775 benefits are claimed and employment and population, there was no correlation between claimed LB 775 benefits and growth in personal income in those counties. Under this theory, 100% of the jobs claimed by LB 775 beneficiaries would have occurred somewhere in the state absent the incentive.
The other end of the range is represented by the Department of Revenue's annual LB 775 report. This report projects revenue gains or losses due to the program assuming that 30% of the jobs and investment would not have occurred absent the benefits. This 30% assumption has been supported by Legislative Fiscal Office research analyzing the act using an input-output model. Newly-created jobs and investment are then assumed to cycle through the economy and generate additional jobs and consumption (and, therefore, state revenue) using generally recognized multipliers.
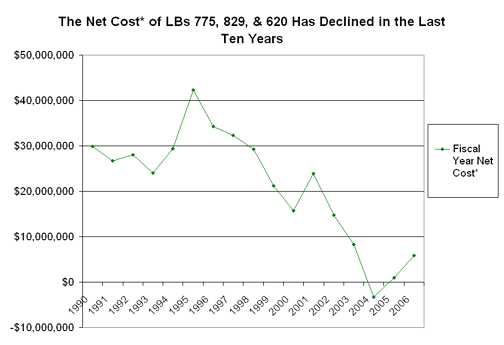
Given this zero to 30% new job range of assumptions, what then does the Employment and Investment Growth Act "cost" the other taxpayers of the state The annual report shows the projected cash flow from LB 775, Quality Jobs Act, and Invest Nebraska Act projects approved through 2005 and estimates that the FY2004-05 net cash flow after the 30% new jobs assumption was $3,335,027. This was the first positive impact ever calculated using this methodology. Since that year, the program has resumed an overall net cost to the state. For FY2006-07, the net cost was $5,910,118. The cumulative cost since the beginning of the program had reached $367 million.
The following chart shows the net cost in every year since 1990.

* FY Net Cost means the estimated cost of LBs 775, 829, & 620 in the fiscal year beginning with the year in column A considering additional economic growth induced using the 30% assumption
-
As can be seen from the chart, the net cost of LBs 775, 829, and 620 has not been increasing. In fact, this cost has been decreasing in recent years as past projects continue to generate additional revenue for the state while new qualifiers hold steady.
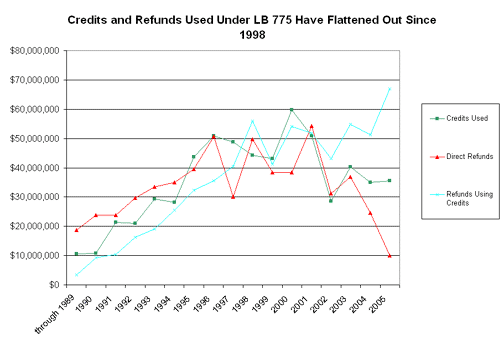
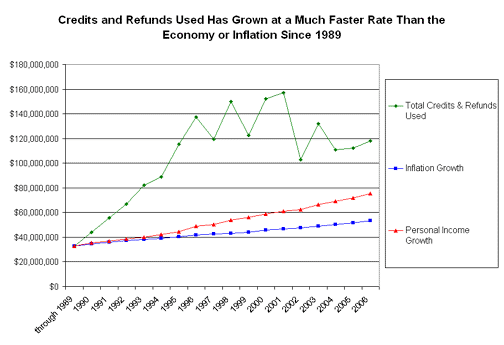
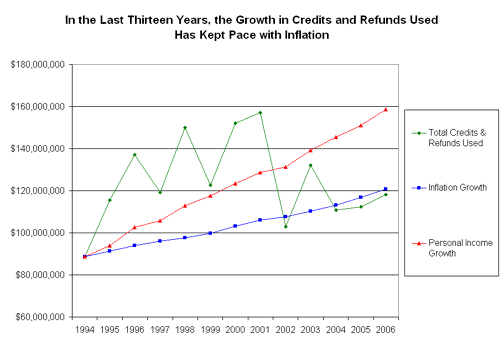
The other end of the range is determined by simply totaling up the number of credits used during the year. This is shown in the charts below. It is appropriate to focus on used credits rather than earned credits because earned credits represent a future liability which may not come to fruition and if it does, will actually impact revenues in future years. According to the Department of Revenue, during calendar year 2006, beneficiaries used $78.4 million of credits and sales tax refunds used as credits net of recaptures. There were also $39.9 million in direct refunds of sales and use taxes. Cumulative through 2006, totals were $1.291 billion in credits used and $608.5 million in direct refunds.


-
As the charts above show, credits, refunds, and credits using refunds largely track together. Total credits and refunds have grown faster than the growth in the economy when measured from the beginning of the program, but grew at about the rate of inflation when only the past 10 years are considered. Tax credits used from year to year are volatile enough that the result depends a great deal on the years selected for the analysis.
However, the cost of LB 775 must include the cost of the property tax exemptions. This can be estimated by multiplying the value of the exempted property times the average statewide property tax rate. This calculation will underestimate the benefit somewhat since most of the exempted property is located in cities which tend to have aggregate property tax rates greater than the state average. Nevertheless, the cost of the property tax exemptions estimated this way yields a result of $8.8 million for 2005.
- As
of this writing, six agreements have been signed under the Quality
Jobs
Act, however, there are not enough companies receiving benefits under
the act to allow disclosure of financial information. There have
been
11 applications approved under the Invest Nebraska Act, all but one
under the rural tier.
- The
cost of the Nebraska Advantage Rural Development Act was $713,000
in FY2004-05, $2,039,500 in FY2005-06 and $1,497,250 in FY2006-07.
Under the legislation the total amount of credits that may be
granted was limited to $2.5 million for FY2004-05 and FY2005-06 and
$3 million for later years.
- Ethanol
production incentives estimated for FY2006-07 total more than $21
million.
The cost of the various ethanol incentive programs since their inception
in 1992 exceeds $200 million.
- For 2002, Nebraska communities were utilizing tax increment financing for 360 redevelopment projects with $22.4 million in tax increment dedicated to such projects. This amount represents more than $1 billion in assessed value that was not available for the other local governments to tax.
|
Credits,
Refunds, and Costs under the Employment and Investment Growth
Act
|
|||||||
|
Year
|
Credits
Used
|
Direct
Refunds
|
Refunds
Using Credits
|
Total
Used
|
Credit
Balance (Unused)
|
|
Fiscal
Year Net Cost*
|
through
1989
|
$10,671,020 | $18,801,509 | $3,388,246 | $32,860,775 | $32,727,226 | ||
| 1990 | $10,849,217 | $23,737,187 | $9,213,374 | $43,799,778 | $89,510,101 | $29,908,362 | |
| 1991 | $21,378,154 | $23,771,846 | $10,388,325 | $55,538,325 | $53,050,863 | $26,698,975 | |
| 1992 | $20,940,197 | $29,713,259 | $16,325,346 | $66,978,802 | $36,385,998 | $28,036,241 | |
| 1993 | $29,260,596 | $33,536,500 | $19,165,462 | $81,962,558 | $60,822,533 | $24,047,442 | |
| 1994 | $28,119,249 | $35,016,144 | $25,576,429 | $88,711,822 | $79,093,201 | $29,450,396 | |
| 1995 | $43,701,987 | $39,440,318 | $32,432,343 | $115,574,648 | $98,822,357 | $42,281,340 | |
| 1996 | $50,905,348 | $50,768,751 | $35,547,699 | $137,221,798 | $40,460,915 | $34,294,671 | |
| 1997 | $48,725,683 | $30,092,262 | $40,400,815 | $119,218,760 | $98,432,869 | $32,367,809 | |
| 1998 | $44,257,680 | $49,765,826 | $56,039,915 | $150,063,421 | $40,477,325 | $29,272,251 | |
| 1999 | $43,027,666 | $38,337,566 | $41,310,334 | $122,675,566 | $49,318,438 | $21,202,843 | |
| 2000 | $59,763,186 | $38,323,129 | $54,053,889 | $152,140,204 | $112,279,300 | $15,760,381 | |
| 2001 | $50,831,192 | $54,352,225 | $51,807,771 | $156,991,188 | $34,047,285 | $23,880,956 | |
| 2002 | $28,608,407 | $31,200,400 | $43,044,802 | $102,853,609 | $35,279,431 | $14,787,321 | |
| 2003 | $40,352,137 | $36,860,024 | $54,788,889 | $132,001,050 | -$6,398,512 | $8,325,744 | |
2004
|
$34,894,898
|
$24,641,813
|
$51,221,202
|
$110,757,913
|
-$28,375,536
|
-
$3,335,927
|
|
2005 |
$35,526,275 |
$9,931,173 |
$66,858,062 |
$112,315,510 |
-$43,822,897 |
$961,785 |
|
| 2006 | $38,405,737 | $39,907,679 | $39,954,492 | $118,267,908 | $2,452,739 | $5,910,118 | |
| Cumulative Total** | $640,216,497 | $608,519,785 | $651,521,424 | $1,900,257,706 | $744,411,537 | -$366,975,442 | |
| *FY
Net Cost means the estimated cost of LBs 775, 829, and 620 in
the fiscal year beginning with 1998 considering additional economic
growth induced using the 30% assumption.
**Taken from 2006 Annual Report - Columns do NOT sum to this total |
|||||||
Additional Information: