Taxes in Nebraska > Users and Uses of Major State and Local Taxes > State Use > State Spending by Category
STATE SPENDING BY CATEGORY

[ Click on an item above to view data for that category ]

|
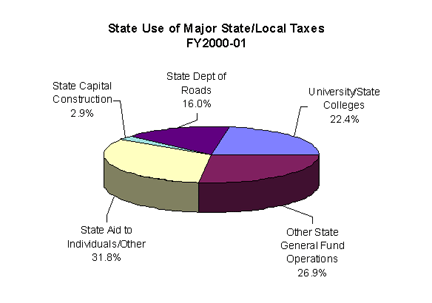
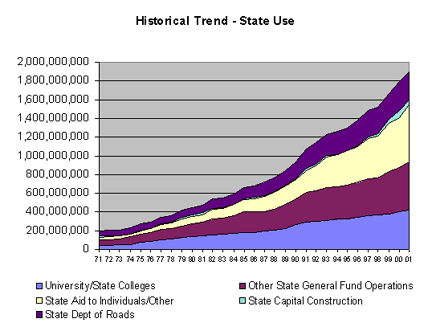
Key Points By clicking on the items in the pie chart above, you can view data related to each of these categories of state spending. State spending on aid to individuals is the largest category of state spending. As can be observed from the area chart above, aid to individuals is also the fastest growing category of state spending. Programs to address developmental disabilities, substance abuse, and the largest subcategory, Medicaid, are included in this area. Data on the rate of growth shows that spending related to aid to individuals has grown 693 percent since 1980. This growth rate is more than three times the rate of the growth in the Nebraska economy, as measured by gross state product (GSP). State spending on higher education (the University of Nebraska and state college systems) makes up about 1/4 of state spending. However, this share is not growing as rapidly as aid to individuals. State roads spending makes up about 16 percent of total state spending (for state purposes), and this category has grown 259 percent since 1980. This is slightly greater than the rate of growth for the Nebraska economy as measured by GSP Capital construction is a relatively small share of state spending, and it is shrinking. It has grown only 165 percent over the 20-year study period, less than any other major category. The "other state operations" category includes state spending by all state agencies except the University of Nebraska and State Colleges. Spending by state agencies has grown 247 percent over the 20 year period, or slightly faster than the Nebraska economy. |
Additional Information:
|